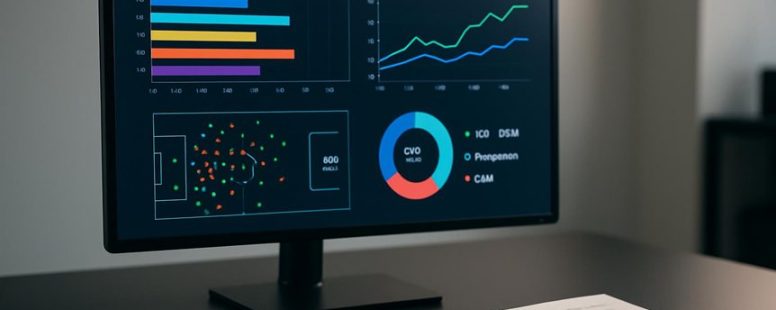
Imagine watching a game and feeling certain about a goal that never quite materializes, or missing out on the subtle clues behind a team’s true strength. That’s where expected goals, or xG, step in—like a secret decoder for scoring chances that considers shot quality and game context.
Not all xG models are equal; some reveal insights that can shift your entire understanding of a match. Knowing which tools to trust can turn raw numbers into a vivid story of performance—and uncover surprises that might otherwise stay hidden.
This is the edge that transforms mere stats into strategic advantage.
What Are Expected Goals (xG) and Why They Matter
Expected Goals, or xG, is a simple way to see how good a scoring chance really is. It tells us the probability that a shot will turn into a goal. For example, a close shot from the penalty box might have an xG of 0.7, meaning there’s a 70 percent chance it scores. This helps us understand not just how many goals a team or player scores, but how many they should have scored based on the chances they got.
Some people use xG to compare players or teams. If one player has many shots but a low xG, they might be lucky or not very effective. If another player has fewer shots but a high xG, they are creating better chances. For instance, Lionel Messi might take fewer shots but get better scoring chances than a less skilled player.
However, xG is not perfect. It can’t see if a player is good at finishing under pressure or if a goalkeeper makes a great save. Sometimes a shot with high xG misses because the player hits it poorly, or a low xG shot scores because of a lucky deflection. So, while xG helps tell a part of the story, it doesn’t show everything.
Some fans and coaches use xG to see if players are performing better or worse than expected. If a player scores more goals than their xG suggests, they might be in good form or just lucky. But if they score less than expected, they might be missing chances or facing tough defenses.
Best Models and Tools for Predicting xG
Predicting xG accurately depends on using models that consider shot location, player positions, and game situations. These factors are the most important for good predictions. Some models focus only on where the shot is taken, but better ones combine multiple data points. For example, a shot from close to the goal is more likely to result in a goal than one from far away, but knowing where players are can change that prediction.
To get reliable results, you need the right tools. There are different software and data sources like StatsBomb, Opta, or Wyscout that give detailed game data. Using these, you can build models that turn raw data into useful predictions. For example, some tools let you track player movements in real time, which helps improve accuracy.
There are two main opinions about these models. Some experts say that combining many data points makes predictions better. Others warn that even the best models can be wrong if they ignore things like player fatigue or unexpected events. So, while these tools can help, they are not perfect.
If you want to make your own xG predictions, here are some simple steps:
Collect data on shot locations, player positions, and game context.
Use software like R or Python to analyze the data.
Build a model that combines these factors.
Test your model with past games to see how well it predicts actual results.
Just remember, no model can predict everything perfectly. They are useful, but always keep in mind their limits.
In short, the best xG models use a mix of shot location, player positions, and game context, and they need good data tools. But even the best models can make mistakes, so use them as guides, not crystal balls.
Top xG Prediction Models
Predicting xG, or expected goals, is a way to estimate how likely a shot is to turn into a goal. The best models for xG use clear criteria to compare accuracy, such as how often they correctly predict goals. Some models use machine learning, which can find patterns in big data, while others rely on simple math formulas. The most useful models find a good balance — they are detailed enough to be accurate but simple enough to understand easily.
Models that include things like shot angle, distance from goal, and pressure from defenders tend to give better predictions. For example, a shot from close range at an open goal has a higher chance of being a goal than one from far away with defenders in front. Comparing these models side by side shows which ones are most accurate and trustworthy.
If you want good xG predictions, you should know what makes each model different. Some may focus on quick stats, while others use more detailed info. A warning is that no model is perfect. They can be wrong if they miss key details or if the game situation changes fast.
In the end, understanding the strengths and limits of top xG models can help your analysis improve. But don’t forget, even the best models are guesses based on past data. They are helpful tools, but they won’t predict every shot perfectly.
Essential xG Analysis Tools
xG analysis tools help us understand how likely a shot is to go in. The best tools are those that give clear data and show it visually. If you want to pick the right ones, look for platforms like StatsBomb and Wyscout. They provide detailed xG numbers and easy-to-understand charts. For example, they can show if a shot was taken from a tough angle or close to the goal. This helps coaches and fans see what really matters in a game.
Some people prefer to make their own xG models. If that’s you, using Python libraries like scikit-learn with visualization tools like Matplotlib or Seaborn can help. These let you build custom models and see the results in graphs. But remember, making your own tools takes time and knowledge. They might give more control but can also be more complicated to set up.
There are two sides to consider. One, ready-made tools like StatsBomb and Wyscout are fast and easy to use. They are great if you want quick insights without much fuss. Two, building your own models can be more flexible but requires skills and patience. If you only want reliable predictions fast, stick with proven platforms. But if you like tinkering and want tailored insights, learning Python tools might be worth it.
In the end, good xG analysis needs tools that show data clearly. Visuals help you see patterns fast, saving time and making your analysis better. Whether you choose ready-made software or build your own, make sure it helps you understand the game better. Without good tools, it’s hard to trust your predictions or spot key moments. So pick wisely and learn how to use your tools well.
Predicting Team Performance With xG Stats
Expected goals, or xG, is a way to measure how likely a team is to score in a match. It looks at the quality of chances created and how well the defense stops those chances. Knowing a team’s xG helps you see if they are lucky or if they truly perform well. For example, if a team scores a lot but has a low xG, they might be scoring from unlikely chances. Conversely, if they have a high xG but score little, they might be unlucky or waste chances.
To use xG stats for predicting team performance, follow these steps: First, compare how many chances a team creates versus how many they give up. Teams that create many good chances and limit the opponent’s chances usually do well over the season. Second, look at trends. If a team’s xG is rising, they might be improving, even if their results don’t show it yet. Third, consider the context — injuries, changes in lineups, or schedule difficulty can affect the accuracy of xG as a predictor.
Some say xG is the best way to forecast results because it looks beyond just wins and losses. Others warn it’s not perfect. For example, teams with strong defenses might have low xG against them, but if their goalkeeper makes many saves, they could still lose games. Also, xG doesn’t always account for set pieces or unexpected events. So, while xG can give an edge, it should be used with other stats and knowledge about the team.
Imagine using xG like a weather forecast. It tells you the chances of rain, but sometimes it gets it wrong. Teams are like that too — sometimes they outperform or underperform their xG. That’s why it’s smart to check multiple stats and keep an eye on how teams are playing.
In the end, xG is a helpful tool, but not a crystal ball. It can give you clues about future results, but it won’t guarantee predictions. Use it wisely, and remember that football is unpredictable.
Understanding Expected Goals
Expected Goals or xG is a number that shows how good a scoring chance is, not just how many goals happen. Many people think xG counts goals, but it actually measures the quality of chances based on things like where the shot was taken and how it was hit. For example, a shot from very close to the goal usually has a higher xG than one from far away.
xG started because analysts wanted a better way to see how well teams create chances, not just look at how many shots they take or how much they hold the ball. It helps us understand if a team is doing well or unlucky. For example, a team might have fewer goals but create better chances, meaning they should score more soon.
Some critics say xG isn’t perfect. It can’t predict every goal because players sometimes miss or make mistakes. Also, it depends on good data and models, which aren’t always 100 percent accurate. Still, many coaches and fans use xG to see which teams are actually playing better and to guess what might happen next.
In short, xG is a useful tool that shows the quality of scoring chances. It helps us see past just goals and shots to understand team performance better. But it’s not perfect, so it’s best used with other stats too.
Analyzing Team Offensive Trends
Understanding how expected goals (xG) measures the quality of scoring chances helps explain how teams create goals. xG assigns a number to each shot, showing how likely it is to score based on factors like shot location and type. This makes it easier to see if a team is good at creating high-quality chances or just lucky.
When analyzing offensive trends, the first step is to look at how often teams convert these chances into goals. This shows a team’s scoring efficiency — do they score from many good chances or just a few? Consistent scoring from high-quality chances indicates a strong offense. Sometimes a team might have many shots but still score little because their chances are low quality.
Next, attacking strategies reveal how teams set up their goal opportunities. Do they focus on quick counterattacks or build from the back? Watching how teams create chances helps predict their future performance. For example, if a team relies on set pieces, they might struggle against good defenses that mark well during corners or free kicks.
Team dynamics also matter. How well do players work together under pressure? Do they adapt when facing tough defenses? Sometimes a team’s offense can be predictable, making it easier for opponents to defend. Other times, they can switch tactics mid-game and surprise defenses.
Finishing skills — how well players convert chances — are another key piece. Some teams depend on a few star players who score most goals, while others have multiple threats. Knowing this helps predict if a team can score even when their top scorer is neutralized.
Matchup analysis looks at how teams match up against each other’s weaknesses. For example, a team strong in crossing might exploit a defense weak in aerial duels. Using xG stats to compare team strengths and weaknesses helps forecast game results more accurately.
Defensive Impact On xG
Defensive impact on xG is just as important as offensive stats like goals or shots. xG, or expected goals, measures how likely a shot is to score based on how and where it’s taken. But good defense can lower those chances.
For example, a goalkeeper who blocks shots or a defender who intercepts passes helps prevent high-quality chances from happening. These actions often don’t show up in normal stats but are huge for the outcome. Teams that change their formation or adjust tactics during a game can also make it harder for opponents to get good scoring chances.
Some players contribute by blocking shots or winning tackles, which makes the team better defensively. These efforts reduce the chances opponents have and lower the expected goals against. But, it’s important to remember that defensive impact isn’t always easy to measure. Sometimes, a player’s smart positioning or quick reactions make a big difference, even if it doesn’t show in the stats.
Two sides exist here. Some coaches and analysts believe focusing on defensive impact helps predict team success. Others say it’s hard to measure exactly and might not always tell the full story. For instance, a team might have a strong defense but struggle to score, so defense alone isn’t enough.
In short, understanding defensive impact on xG means seeing beyond the obvious. When teams make smart defensive moves, they give up fewer high-xG chances and improve their chances of winning. So, when analyzing a team’s performance, it’s smart to look at both offense and defense.
Using xG to Forecast Player Performance and Growth
xG, or expected goals, is a useful tool to predict how a player might perform and grow over time. It is a simple way to see not just how many goals a player scores but also how they make decisions and position themselves during a game. Coaches and scouts can use xG data to find players with strong potential by looking at detailed stats that show where a player is good and where they need improvement. For example, if a young forward’s xG shows they often get into good scoring places, they are likely to improve more. But keep in mind, xG is not perfect. Sometimes players do better or worse than their xG suggests because of luck or other factors. It is a helpful guide but not a crystal ball.
Using xG for predictions has two main views. One side says it helps spot talent early and plan better training. The other side warns that relying too much on xG can miss the bigger picture, like a player’s work ethic or team fit. Coaches should use xG along with other skills and observations.
Think of xG as a weather forecast for a player’s future. It can show chances of success but cannot guarantee what will happen. It is a powerful tool but works best when combined with experience and judgment.
In simple terms, xG helps turn raw stats into useful ideas about a player’s future. But it’s just one piece of the puzzle. Always check other factors before making big decisions.
How xG Influences Betting Odds and Football Markets
xG, or expected goals, is a simple way to measure how likely a team is to score based on the quality of chances they create. It isn’t just useful for coaches or scouts—it’s also a powerful tool for betting on football games. Bookmakers look at xG data to set the odds because it shows how good a team really is at scoring, beyond just the final score. If a team’s xG is high but they didn’t score many goals, their chances of improving are good, and this can influence the odds to go down. On the other hand, if a team scores more than their xG suggests, they might be lucky or playing better than usual, and the odds might shift to reflect that.
Smart bettors use xG to find value bets. For example, if a team has been outperforming their xG over several matches, they might be a good bet because the odds might not yet reflect their true strength. Conversely, teams that underperform their xG might have inflated odds, making them tempting bets. Tracking these changes can help bettors predict how the market will move and make better bets.
Some people warn that xG isn’t perfect. It doesn’t consider things like player injuries, weather, or team tactics that can change game outcomes. Also, not all xG models are the same. Using a flawed or outdated model could lead to wrong bets. So, while xG gives useful insights, it’s not a guarantee. It’s best to combine xG with other info for smarter betting.
In the end, understanding how xG impacts betting odds can give you an edge. It turns raw stats into real betting clues, but it’s important to remember that no system is perfect. Always keep a critical eye and don’t rely on xG alone.
Common Challenges With Expected Goals (xG) Predictions
Expected goals (xG) models help predict how likely a shot is to become a goal in soccer. But they are not perfect. Here are three common problems with xG predictions:
Data problems and bias: The accuracy of xG depends on good data. If the data is incomplete or biased, the predictions can be wrong. For example, if past games don’t include recent changes in team strength or tactics, the model might give false results.
Match conditions and player factors: Things like weather, injuries, or team tactics often aren’t included in xG models. Imagine a player taking a shot during heavy rain or after getting hurt. These situations can change the outcome but may not show up in the data.
Randomness in scoring and team changes: Sometimes, a team might miss easy shots just by luck. Or, teams change their style during a game, making predictions less accurate. For example, a team might usually score from set pieces but suddenly plays more defensively.
Knowing these issues helps us understand that xG is a useful tool but not a crystal ball. It can guide us but it is not always 100 percent accurate. Just like in sports, surprises happen. Be careful not to trust predictions blindly.
Tips to Interpret and Use xG Stats Like a Pro
Expected goals (xG) is a stat that shows how likely a shot in soccer was to go in. It helps you understand how good a team or player really is, beyond just goals scored. But remember, xG is not a perfect prediction tool. It gives a chance, not a guarantee. For example, if a team has a high xG but few goals, they might be unlucky or lacking finishing skills. On the other hand, a team with low xG but many goals could be overperforming.
To get the most out of xG data, follow these steps. First, look at trends over many games, not just one match. A single game can be misleading. Second, pay attention to shot quality. Shots from close range or in the penalty box usually have higher xG than long-range shots. Third, consider the situation. Was the shot taken during a counterattack or a set-piece? These details help you understand what the numbers mean.
Some people think xG can predict exact results like wins or losses, but it cannot. It only shows probabilities. For example, if a team has an xG of 2.0 in a game but scores only once, they might be underperforming. This can point to poor finishing or bad luck. Conversely, if they score more than their xG suggests, they might be overperforming.
Using xG wisely can help you spot teams creating many chances but not finishing them, or teams scoring on fewer chances but converting well. This can tell you if a team is lucky or unlucky, or if they need to improve their finishing. But, be careful. xG has limitations, like not accounting for goalkeeper skills or deflections. It’s a helpful tool, but not the only one to rely on.
In the end, understanding xG takes practice. Look at many games, check shot details, and compare expected goals with actual results. This way, you can better judge teams and make smarter predictions. Remember, xG is a tool to help your analysis, not a crystal ball. Use it wisely and always keep in mind its flaws.
To provide the best experiences, we use technologies like cookies to store and/or access device information. Consenting to these technologies will allow us to process data such as browsing behaviour or unique IDs on this site. Not consenting or withdrawing consent, may adversely affect certain features and functions.
Functional
Always active
The technical storage or access is strictly necessary for the legitimate purpose of enabling the use of a specific service explicitly requested by the subscriber or user, or for the sole purpose of carrying out the transmission of a communication over an electronic communications network.
Preferences
The technical storage or access is necessary for the legitimate purpose of storing preferences that are not requested by the subscriber or user.
Statistics
The technical storage or access that is used exclusively for statistical purposes.The technical storage or access that is used exclusively for anonymous statistical purposes. Without a subpoena, voluntary compliance on the part of your Internet Service Provider, or additional records from a third party, information stored or retrieved for this purpose alone cannot usually be used to identify you.
Marketing
The technical storage or access is required to create user profiles to send advertising, or to track the user on a website or across several websites for similar marketing purposes.